Observability and Delivery: Running Production Systems
Operate what you ship. Metrics, logs, traces and profiles as four different measurements, instrumentation with OpenTelemetry, the arithmetic of cardinality, sampling that keeps the interesting traces, Prometheus internals and PromQL, long term storage, log pipelines, distributed tracing in practice, correlating signals during an incident, service level objectives and error budgets, alerting on symptoms, dashboards people actually open, on-call and incident command, postmortems that change something, CI pipelines, blue green and canary deployments, GitOps, feature flags, capacity planning, load testing, chaos experiments and cost as a reliability concern.
Course Overview
Shipping a system is the easy half. The hard half is the two years afterwards, when the service is carrying real traffic, the person who wrote it has moved teams, and a page fires at 03:40 saying that the checkout error ratio is above one percent. Everything you can do in that moment was decided earlier: what the system emits, what is stored and for how long, what the alert was defined against, whether anyone can find the dashboard, and whether the change that caused it can be reversed in one command. This course is that preparation, taught as an engineering discipline with numbers rather than as a tour of tools.
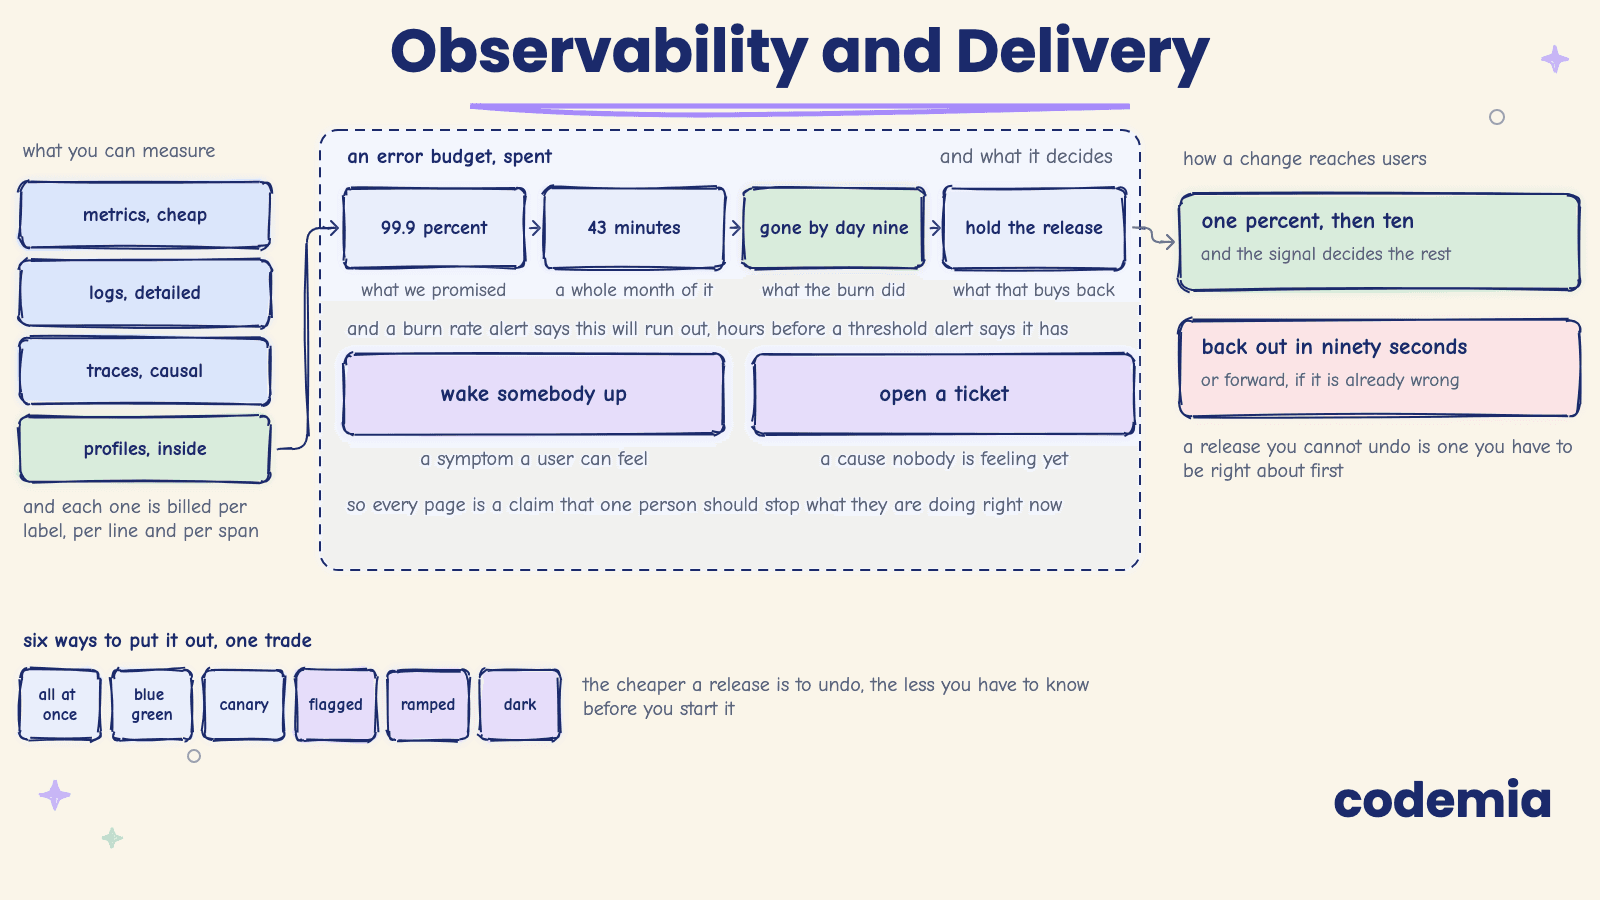
It opens with the four signals, treated as four genuinely different measurements rather than as a stack of logging products. A metric is a counter sampled over time and costs almost nothing per event. A log is a record of a single event and costs in proportion to traffic. A trace is one request's path across services, which is the only signal that can answer where the time went. A profile is what the CPU or the heap was doing inside a process, which is the only signal that can answer why a service is slow when nothing it calls is slow. Each lesson works out what a signal can and cannot tell you, because most wasted observability spend is one signal being used to answer a question another signal answers in seconds.
Then instrumentation, with OpenTelemetry as the concrete library: what a span is, how context propagates across a network hop, what the collector does, and what breaks when it does not. The cardinality lesson is the most financially consequential one in the course. A label with a user id in it turns one time series into millions, and the arithmetic of that explosion, from series count to memory to bill, is worked out in full. Sampling follows, because at scale you cannot keep every trace, and the difference between head sampling and tail sampling decides whether you keep the ones that matter.
The metrics section opens Prometheus: the scrape loop, the time series database and its blocks, the memory model, PromQL evaluation and the rate function that almost everyone gets subtly wrong, recording rules that make dashboards cheap, and the federation and remote write paths that carry data beyond one server's retention. The logs and traces section does the same for a log pipeline, from structured logging at the call site through collection, buffering, indexing and retention, and for distributed tracing as it actually behaves when half the fleet is instrumented and half is not.
Reliability targets are treated precisely. A service level indicator is a ratio of good events to valid events, an objective is a target on that ratio over a window, and an error budget is what the objective leaves you to spend. The alerting lesson argues for paging on symptoms rather than causes and shows what burn rate alerts look like with the multipliers and windows written out. Then the human half: on-call rotations that people can sustain, incident command and the discipline of communication during an outage, and postmortems that produce a changed system instead of a document.
Delivery closes the loop, because most incidents are caused by a deployment. Continuous integration and build hygiene, blue green and canary with the traffic arithmetic and the automated rollback criteria, GitOps and declarative rollouts, and feature flags as the mechanism that separates deploying code from releasing behaviour. The last section is resilience: capacity planning from measured headroom, load testing that reproduces real traffic shapes, chaos experiments run as experiments with a hypothesis, runbooks and the automation of toil, and efficiency treated as a reliability property rather than a finance one.
Every lesson names real defaults, works the arithmetic with real numbers, and prefers the failure case to the happy path. By the end you will be able to choose the right signal for a question, predict what an instrumentation decision will cost, define an objective your team can defend, write an alert that is worth waking someone for, and run a deployment whose failures are visible and reversible.
Course Content
7 Chapters • 24 Lessons
Not what you were looking for? Have Basis Lab write you a course on it. It is a separate product from the same team, and the first course is free.
Enroll Now
Get instant access to all current and upcoming courses by subscribing.