Post
Metrics Monitoring and Alerting System Design: A Complete Interview Answer
How to design a Prometheus or Datadog style monitoring system in an interview: requirements, capacity math for 5 million samples per second, push versus pull collection, time series storage and compression, downsampling, cardinality, and an alerting pipeline that does not page people at 3am for nothing.
.png)
By Codemia • October 8, 2026
13 min read
"Design a metrics monitoring and alerting system" is one of the most useful questions you can prepare for. It shows up in infrastructure, platform and SRE loops, and companies that sell observability ask it constantly. It is also a system every interviewer has used and has opinions about, which means vague answers get caught quickly.
The good news is that the problem has a clear shape. There are five parts: collect, ingest, store, query, alert. Each one has one or two decisions that matter, and most of the interview is about making those decisions with numbers.
This guide gives a complete answer in the order you would deliver it.
This problem is on Codemia as Design a Metrics Monitoring and Alerting System, rated hard. If you want to test yourself, write your own design first and submit it for AI feedback, then compare with this guide. The link is at the end.
1. Requirements
Functional requirements
- Collect metrics from servers, containers and applications: CPU, memory, request rate, error rate, latency percentiles, queue depth, and custom business metrics.
- Store them as time series and keep them for a configurable retention period.
- Query them for dashboards and ad hoc investigation: "p99 latency of the checkout service, per region, over the last 6 hours".
- Alert when a condition holds: a threshold ("error rate above 2% for 5 minutes"), an absence ("no heartbeat for 2 minutes"), or optionally an anomaly.
- Notify through the right channel (pager, chat, email) for the right team, without flooding anyone.
Out of scope unless the interviewer asks: logs and traces (different storage shapes), full dashboard UI design, and billing.
Non-functional requirements
- Write heavy. Writes outnumber reads by orders of magnitude. Almost every sample is written once and never read individually.
- Recent data is hot. Most queries hit the last few hours. Old data is read rarely and at coarse resolution.
- Alerting must be reliable and fast. A missed page during an outage is the worst failure this system can have. Aim to fire within a minute of a condition becoming true.
- The monitoring system must outlive what it monitors. It has to keep working during the incidents it exists to detect, including partial network failures.
- Some data loss is tolerable. Losing a few seconds of CPU samples is fine. Losing an alert is not. This asymmetry drives several decisions below.
2. Capacity estimation
Pick numbers and commit to them. Say a large company:
- 100,000 hosts and containers, each exposing about 500 metrics once labels are counted.
- That is 50 million active time series.
- Collected every 10 seconds, that is 5 million samples per second.
Storage:
- A raw sample is a 64 bit timestamp and a 64 bit float, 16 bytes. Uncompressed, 5 million samples per second is about 6.9 TB per day.
- Time series compress extremely well. Facebook's Gorilla paper reported an average of 1.37 bytes per sample using delta-of-delta timestamps and XOR-encoded values. At that rate it is about 590 GB per day.
- Keep raw data for 15 days: about 9 TB. That fits on a modest cluster.
Long retention needs downsampling:
- 1 minute rollups (min, max, sum, count) for 90 days: 50 million series times 129,600 minutes times about 10 compressed bytes is about 65 TB.
- 1 hour rollups for 2 years: about 9 TB.
Network: on the wire, with metric names and labels, a sample is closer to 100 bytes before compression, so ingestion is around 500 MB per second. That number tells you ingestion must be horizontally scaled.
The headline: the hard parts are write throughput and the number of distinct series, not the total bytes. Say that explicitly.
3. Data model and API
A time series is identified by a metric name plus a set of labels:
Each series is a sequence of (timestamp, value) samples. The common metric types:
- Counter: only goes up, such as total requests. You query its rate.
- Gauge: goes up and down, such as memory in use.
- Histogram: counts observations into buckets, so you can compute percentiles at query time and aggregate them across instances.
Averaging percentiles across hosts is mathematically wrong. Histograms are how you get a correct fleet-wide p99, and mentioning this is a good signal.
Minimal API:
4. Collection: push or pull?
This is the first real decision and interviewers expect you to argue it.
Pull (Prometheus style). Each target exposes a /metrics endpoint. Collectors scrape targets on a schedule, discovering them through service discovery (Kubernetes, Consul, cloud APIs).
- You know when a target is down, because the scrape fails. That is free health checking.
- The collector controls the rate, so a misbehaving app cannot flood the system.
- It struggles with short-lived jobs, which may finish between scrapes, and with targets behind NAT or firewalls.
Push (Datadog, StatsD, OpenTelemetry style). An agent on each host sends metrics to an ingestion endpoint.
- It works for short-lived jobs, serverless functions and hosts that cannot be reached from outside.
- A silent host looks the same as a healthy host with nothing to report, so you need explicit heartbeats.
- You must protect ingestion from bursts with rate limits and backpressure.
The answer to give: support both, with an agent on each host. The agent scrapes local endpoints (pull, locally) and pushes batches to the ingestion tier (push, over the network). This is what most modern setups converge on: local pull for simplicity and health checks, remote push for reachability. Short-lived jobs push to the agent or to a gateway.
5. High level architecture
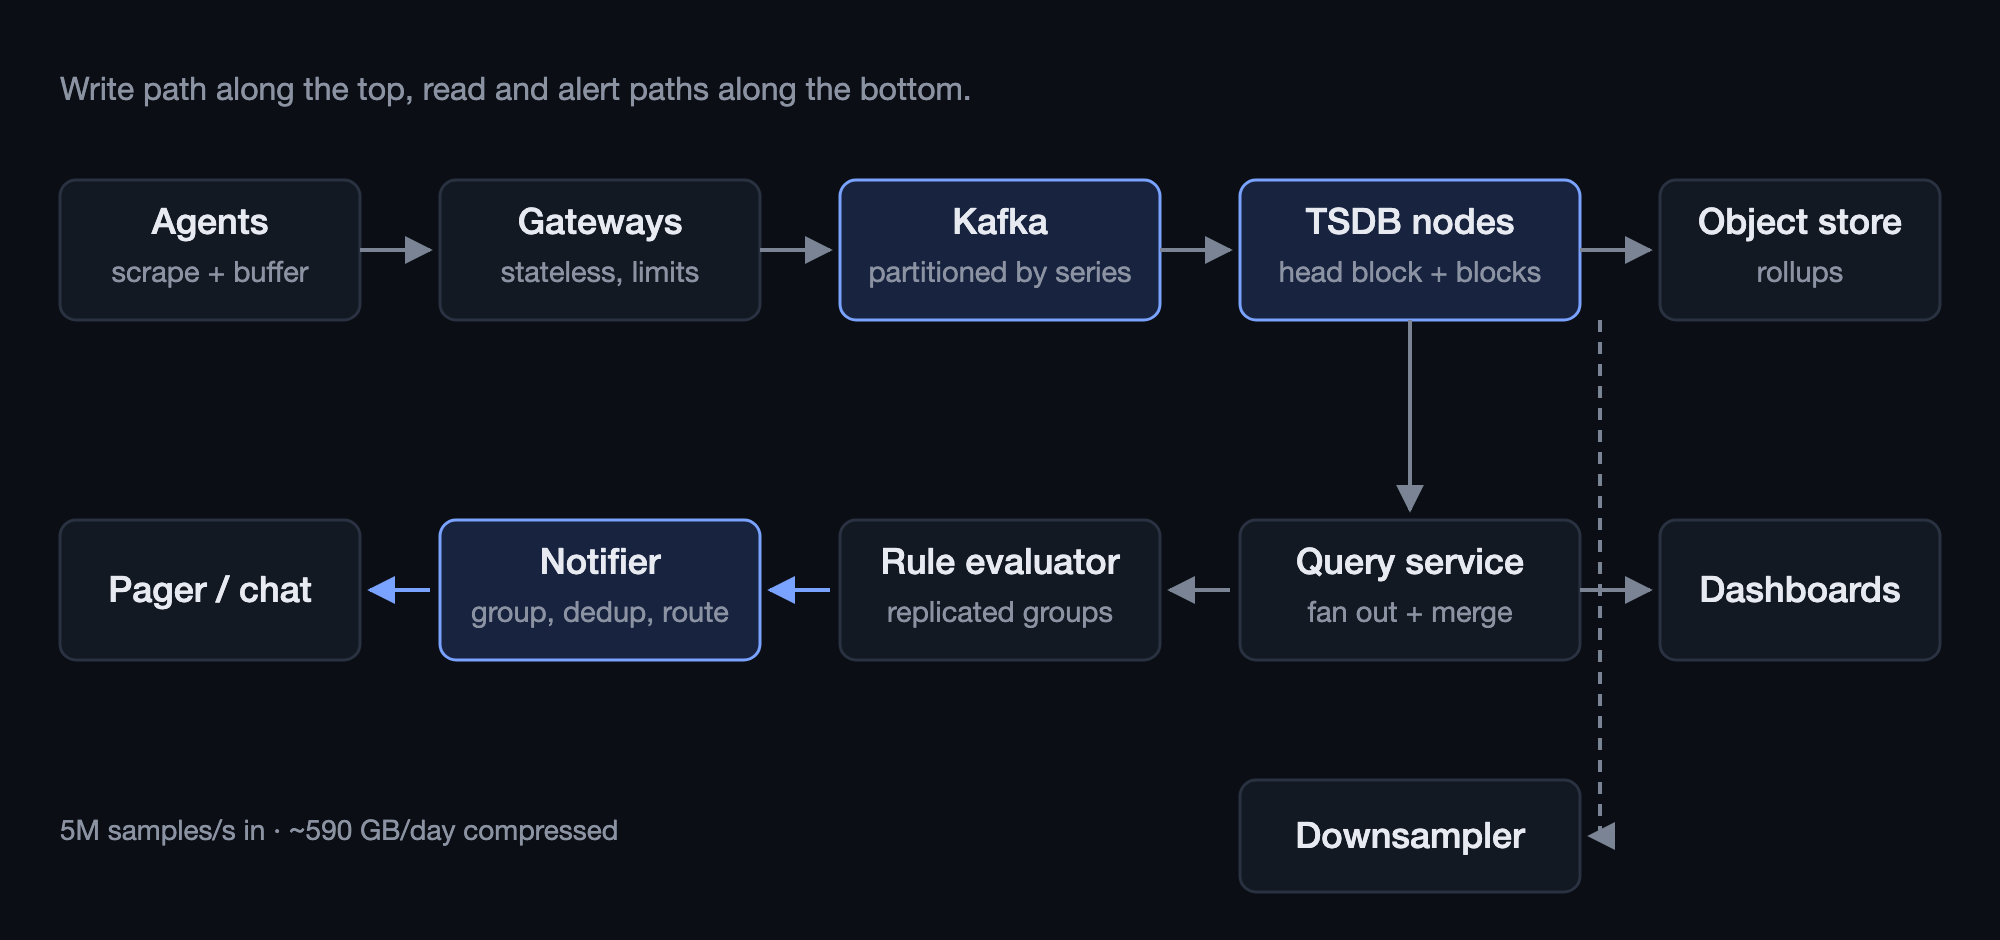
- Agents on every host collect, batch and compress samples, and buffer to local disk if the network is down.
- Ingestion gateways are stateless. They authenticate, validate, enforce per-tenant limits, and write to the log.
- A partitioned log such as Kafka sits between ingestion and storage, partitioned by a hash of the series identity. It absorbs bursts, lets storage nodes restart without losing data, and lets other consumers (the alerting pipeline, a streaming anomaly detector, an archiver) read the same stream.
- The time series database (TSDB) consumes from the log. Each storage node owns a set of partitions, so all samples of a series land on the same node.
- The query service parses queries, fans out to the relevant storage nodes, merges the results and caches common dashboard queries.
- The rule evaluator runs alert rules on a schedule against the query service.
- The notifier groups, deduplicates and routes alerts to pagers, chat and email.
Is the log necessary? At 5 million samples per second, yes. Without it, a slow storage node pushes backpressure all the way to the agents. A smaller design can write straight from gateways to storage with replication, and it is fine to say that the log is the first thing you would drop at a tenth of the scale.
6. Storage: the time series database
This is the deep dive most interviewers want. A general-purpose database will not keep up. Here is why, and what a TSDB does instead.
Why not just use Postgres or Cassandra?
- One row per sample means 5 million inserts per second and an index entry for each one.
- No compression designed for slowly changing numbers.
- Queries scan a time range of one series, which is a poor fit for a row store indexed per row.
Wide-column stores like Cassandra or HBase can work (OpenTSDB was built on HBase), but purpose-built engines like Prometheus's TSDB, VictoriaMetrics, M3 or InfluxDB do far better.
How a TSDB stores data
- Write-ahead log first, for durability.
- In-memory head block holds the last couple of hours of each series, appending samples to compressed chunks.
- Compression: timestamps arrive at near-regular intervals, so store the delta of the delta, which is usually zero and fits in one bit. Values change slowly, so XOR each value with the previous one and store only the meaningful bits. This is where 16 bytes becomes about 1.4.
- Immutable blocks: every two hours or so, the head is flushed to an immutable block on disk covering that time range. Older blocks are compacted into larger ones.
- Inverted index: each block keeps a map from each label pair (
service="checkout") to the list of series that have it. A query forservice="checkout", status="500"intersects two posting lists, exactly like a search engine.
Sharding and replication
- Shard by a hash of the series identity (name plus sorted labels), so one series lives on one node and a range read is local.
- Replicate each shard to two or three nodes. Because the log can be replayed, a failed node can be rebuilt from the log plus a replica.
- A query for "all checkout series" touches many shards. The query service fans out in parallel and merges.
Downsampling and retention
- A background job reads finished raw blocks and writes 1 minute and 1 hour rollups, keeping min, max, sum and count so averages and extremes are both available.
- Raw blocks older than 15 days are deleted. Rollups move to cheaper object storage.
- The query service picks the resolution automatically. A one year graph never touches raw data.
Cardinality: the problem that takes these systems down
The number of series, not the number of samples, is what kills a monitoring system. Every series costs memory in the head block and an entry in the index. Someone adds user_id as a label on a request counter and 50 million series becomes 5 billion overnight.
Defences worth naming:
- Per-tenant and per-metric series limits at ingestion, with rejected writes reported back to the owner.
- Label value allow lists or hashing for known risky labels.
- Cardinality dashboards so teams can see which of their metrics are expensive.
Interviewers who have run these systems light up when you bring this up without being asked.
7. Query layer
- Use a query language with functions for rate, aggregation by label, and histogram quantiles. Saying "something like PromQL" is fine.
- Fan out and merge. Push aggregations down to storage nodes where possible, so each node returns partial sums rather than raw series.
- Cache dashboard queries. Dashboards refresh the same queries every 30 seconds. Cache results by query and aligned time range, and only compute the newest step.
- Protect the cluster. Limit series and samples per query, and time out expensive queries. One engineer's year-long, all-hosts query should not slow down alert evaluation.
Better still, run the alert evaluator on its own query path or replicas so dashboards can never starve alerts.
8. Alerting
This is the part users actually feel. Good alerting is about precision as much as recall: a page that turns out to be noise teaches people to ignore pages.
Rule evaluation
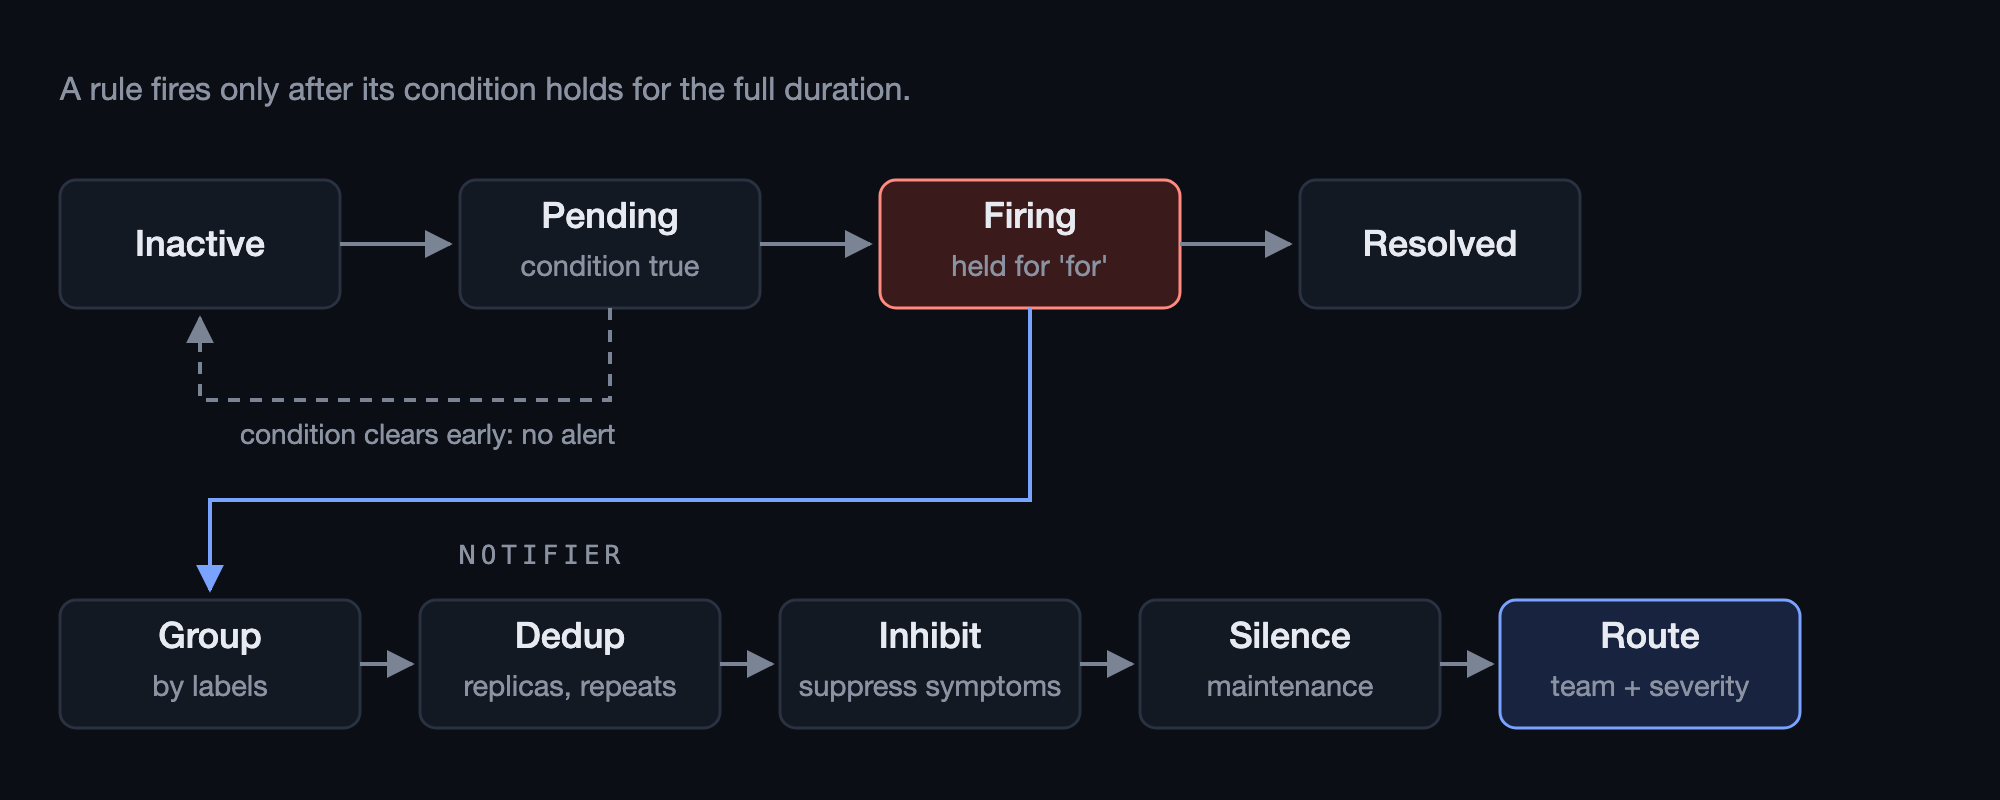
An alert rule is a query, a condition and a duration:
- The evaluator runs every rule every 15 to 60 seconds.
- An alert goes inactive → pending when the condition first becomes true and pending → firing only after it has held for the full
forduration. That one field removes most noise from brief spikes. - Shard rules across evaluator instances by rule group, and run two replicas of each group. Both replicas fire, and the notifier deduplicates. That is cheaper and safer than leader election.
Notification pipeline
When 200 hosts lose their database at once, nobody wants 200 pages.
- Grouping: batch alerts that share labels (same alert name, same cluster) into one notification, with a short wait to collect the group.
- Deduplication: the same alert from two evaluator replicas, or the same alert still firing, produces one notification, then reminders at a set interval.
- Inhibition: if "data center unreachable" is firing, suppress the hundreds of alerts it causes.
- Silences: engineers can mute alerts during planned maintenance.
- Routing: severity and team labels decide the channel. Pages go to the on-call engineer, warnings go to the team channel.
- Delivery guarantees: notifications are retried with backoff and every delivery is logged. If the pager provider is down, fall back to a second channel.
Flapping
A metric hovering around a threshold fires and resolves repeatedly. Fix it with hysteresis (fire above 2%, resolve below 1.5%), a for duration on resolution as well as on firing, or both.
Absence alerts
"No data" is often the most important signal. A crashed service stops reporting rather than reporting zero. Every critical service should have an alert on missing heartbeats, and the pull model gives you this for free through scrape failures.
9. Monitoring the monitoring system
What happens when the monitoring system itself breaks? It cannot page you about its own outage.
- Dead man's switch: an alert that is always firing, sent to an external service. If that external service stops receiving it, the external service pages you. This catches a dead evaluator, a dead notifier or a network partition.
- A small, independent meta-monitoring stack in a different region or account watches the main one.
- Ingestion lag (how far the TSDB consumers are behind the log) is the single most useful health metric. If it grows, alerts are evaluating stale data.
10. Failure modes worth discussing
| Failure | What happens | Mitigation |
| Network partition between region and central cluster | Metrics stop arriving | Agents buffer to disk, regional ingestion, alerts evaluated regionally for critical rules |
| Storage node dies | Its shards stop accepting writes | Replicas serve reads, log replay rebuilds the node |
| Ingestion burst after an outage | Agents flush buffers at once | Kafka absorbs it, gateways rate limit, agents back off with jitter |
| Cardinality explosion | Head block memory grows until nodes crash | Per-metric series limits at ingestion, alert on series growth |
| Expensive query | Query nodes saturate | Query limits, separate query path for alert evaluation |
| Evaluator crash | Alerts stop firing | Replicated rule groups, dead man's switch |
11. What the interviewer is listening for
| Area | Weak answer | Strong answer |
| Estimation | Skips it or stops at "lots of data" | Series count, samples per second, compressed bytes per sample, retention tiers |
| Collection | Picks one with no reason | Argues push versus pull, lands on a local agent with remote push |
| Storage | "Store it in Cassandra" | TSDB internals: head block, delta-of-delta and XOR compression, immutable blocks, inverted index |
| Scale risks | Total bytes | Cardinality, with concrete defences |
| Alerting | "Check thresholds and send email" | for durations, grouping, dedup, inhibition, routing, flapping, absence alerts |
| Reliability | Not addressed | Alerting isolated from dashboards, replicated evaluators, dead man's switch |
12. Common mistakes
- Designing a log search system. Logs and metrics have different shapes. Metrics are small numeric samples on known series; do not reach for Elasticsearch.
- Averaging percentiles. Use histograms and compute quantiles from aggregated buckets.
- Treating every sample as precious. Durability for alerts, best effort for individual samples. Paying for strong guarantees on every CPU reading is wasted money.
- Letting dashboards and alerts share a fate. A heavy dashboard query should never delay a page.
- No answer to "who monitors the monitor?"
Practise it
This guide is long because the problem is deep, and you will not have time to cover all of it in 45 minutes. In a real interview, cover requirements, estimation and the architecture in the first 20 minutes, then let the interviewer pick one or two deep dives: usually storage or alerting.
To practise under realistic conditions, try Design a Metrics Monitoring and Alerting System on Codemia. Write your design, draw the architecture, and get AI feedback against the problem's rubric on what you covered and what you missed.
Related problems that reuse the same building blocks: an ad click aggregation system (streaming aggregation at high write volume) and a distributed task scheduler (reliable scheduled execution, like the rule evaluator).